The problem(s) with Open Data
To put this blog post into context; this is written by a 25-year-old developer who uses the Dutch open data (https://data.overheid.nl) and doesn't like to read too much. I rather hack tutorials than read specs and I code stuff for the use of the public, i.e.: data needs to accommodate to the common people.
With that out of the way and allowing you to see this from my perspective here goes; the biggest problem(s) with Open Data.
I love Open Data, I love all kinds of data really, I can easily browse my phpMyAdmin page for an entire day and not get bored.
I also love real-timeness and my first use of data/APIs was with the Twitter API.
Can't get it more real-time than that!
But the open data ecosystem (in the Netherlands at least) is just like a retirement home, where one zealous intern occasionally organizes bingo events and turns the place buzzing before it's time for pudding.
Static data
As you can see I like real-time data, here's where we see one problem; dead tree data a.k.a. static data.
Sure, it's nice to have any data at all, but what's the added benefit of forging this into something interactive,
like an app for example? Static data is only useful for infographics, graphs or historical references.
The Dutch open data collection contains a lot of this dead weight data (sorry, I like to make up silly synonyms). Big files containing lots of numbers, which, in their appropriate use case, can provide a lot of insight, no doubt. But it's this category of infographics and historical references that pioneers this data. I'm sure that when you add geographical data it could be slightly more interesting, you can view the information on a map, but it's still a bunch of static information whether you view it in an infographic or on a map.
Data formats and delivery
There's a big movement within the Open Knowledge sphere that we need to push for Open Formats. This is wonderful and most formats are indeed open. But what does open mean? It clearly doesn't mean accessible.
Most of the Open Data sets at Overheid.nl that contain geo-data (which I find the best kind of data) are using this wonderful X,Y coordinate system called 'Rijksdriehoekscoördinaten', a word that even for Dutch standards is long. This system is based on ancient times when we had to plot stuff from 3 points, preferably high points like churches or hills.
The code below shows you how to convert RD to WGS, by brute forcing it with pow()'s and floats. You don't want to convert this data on the fly! Specially not in Javascript.
function rd2wgs ($x, $y)
{
    // Calculate WGS84 coordinates
    $dX = ($x - 155000) * pow(10, - 5);
    $dY = ($y - 463000) * pow(10, - 5);
    $SomN = (3235.65389 * $dY) + (- 32.58297 * pow($dX, 2)) + (- 0.2475 *
    pow($dY, 2)) + (- 0.84978 * pow($dX, 2) * $dY) + (- 0.0655 * pow($dY, 3))
    + (- 0.01709 * pow($dX, 2) * pow($dY, 2)) + (- 0.00738 * $dX) + (0.0053 *
    pow($dX, 4)) + (- 0.00039 * pow($dX, 2) * pow($dY, 3)) + (0.00033
    * pow($dX, 4) * $dY) + (- 0.00012 * $dX * $dY);

    $SomE = (5260.52916 * $dX) + (105.94684 * $dX * $dY) + (2.45656 *
    $dX * pow($dY, 2)) + (- 0.81885 * pow($dX, 3)) + (0.05594 *
    $dX * pow($dY, 3)) + (- 0.05607 * pow($dX, 3) * $dY) + (0.01199 *
    $dY) + (- 0.00256 * pow($dX, 3) * pow($dY, 2)) + (0.00128 *
    $dX * pow($dY, 4)) + (0.00022 * pow($dY,2)) + (- 0.00022 * pow($dX, 2))
    + (0.00026 * pow($dX, 5));

    $Latitude = 52.15517 + ($SomN / 3600);
    $Longitude = 5.387206 + ($SomE / 3600);

    return array(
        'latitude' => $Latitude,
        'longitude' => $Longitude
    );
}
But then we got satellites and GPS and Europe even has their own Galileo project (what's happening with that?) so coordinates became global. Truth be told, a lot of the internet innovations have been led by the United States to a point where GPS coordinates, actually called WGS 84 (oh god no, specs!), are the de-facto digits we use when it comes to geographical data. So why do we still use this RD system? The answer is probably legacy code..
Delivery
So there are some annoying formats, that while open are not accessible at all. But how does this get delivered?
For any person who's native tongue is not Dutch, it's impossible to use any of the data. A lot of open data sets are behind websites, weird link structures,
deeply nested Dutch named folders FTP servers and whatever horrible solution you can think of.
I haven't checked everything out, but I don't think there's any dataset that comes with a RESTful API. But that was to be expected, since most data is static.
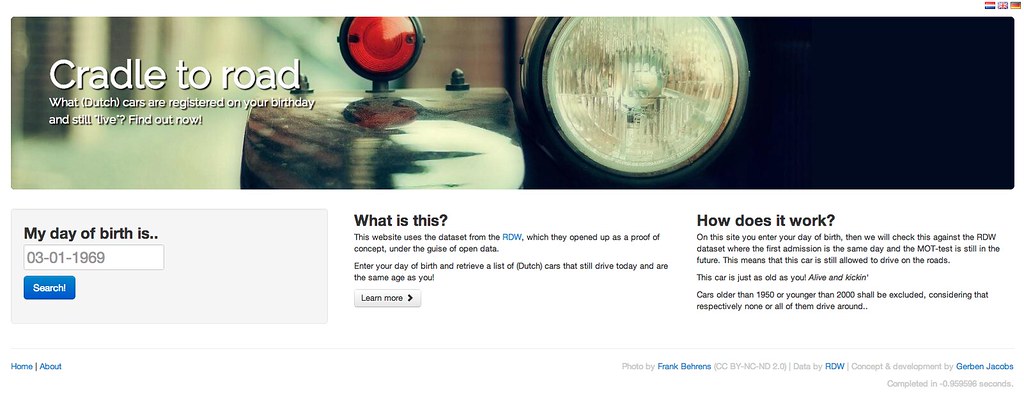
I do have actively used 3 datasets though; meteorological data by the KNMI (weather service), sensory data from Rijkswaterstaat (agency for infrastructure and environment) and car registration data from RDW.
For that last one I made "Wieg tot Weg" when they first opened their data to the public along with a competition, which I became 3rd in! They actually used Microsoft's Azure cloud-platform to have some kind of API, not properly RESTful though.
For the first one I wrote what I call an "API", but it's not really, just see for yourself. And at the moment I'm making a library for the sensory data from RWS that combines some of the files (.dat and .adm. Wtf?) that they put in their zip-file. The library is at a hacked stage; yes it works, but no it won't win "Best code ever"-awards.
If you look at the class I wrote,
you can see through what kind of hoops I have to jump to collect and combine the data. First 1) download a .zip, 2) unzip it, 3) collect the .adm and .dat files,
4) explode() them on newlines, 5) then per line parse them as comma-seperated values, 6) also trim the data values (whitespace everywhere!),
then when both files are as arrays in memory, 7) combine them on their linenumber (so fragile!) and 8) format them a bit.
At the moment I still haven't incorporated the locations XML file, this file does however contain GPS coords instead of RD, so a plus point there!
But the point here, at least now 'normal' people can use the data, you don't need to have a PhD in Fluid Mechanics (yeah, I actually had to look this stuff up to decipher the dataset) and use the tools of the trade, some obscure Visual Basic program that only runs on governmental supplied Windows XP machines.
Bureaucracy
Which brings me to the last point, for which I'm not sure if this is the right heading title, but we all hate the bureacracy so it will do!
What I mean here, is the fact you have to open this data in ancient programs, which are used in the governmental industry and while they probably work, it's not what's being used in tech. Just like the RD coordinates I already mentioned, there are other bumps in the open data road. A favourite format/extension (I don't even know exactly what it is!) is 'GIS'. Which is 'open' of course. But you need this program OpenGIS or ArcGis or VB6XPOpenGovSuperExclusiveGIS, okay maybe that last one won't work but I hope you catch my drift.
Why not JSON or XML with GPS coordinates? Or be totally hip and provide them as
GeoJSON so they instantly work in Github.
Ask yourself "Who am I opening up this data for?", if the answer is your colleague in another department or ministry, then carry on.
If not, hire some adviser and 'youthify' your data.
How to fix Open Data

This surely isn't a checklist, just merely some of my ideas and I hope some discussion material for whoever (that damn bureacracy!) is in charge.
Note that when I say 'fix', I mean make it accessible to all the young hipster programmers out there that can actually skyrocket the open data initiative, open it up to the broader public and have open data interest and passion be something that could end up in the Maslow pyramid. Or at least the public agenda.
- Open AND accessible formats (XML, JSON, CSV, TSV)
- Cut the bureaucracy, show code (Use Github, it's hip!)
- Focus on live data (that's the most interesting, sorry infographics!)
Even when I'm done with my water sensory library and finding no usecase to use it and having that licensenumber app which is just a gimmick, I know that one day the ideas will be in overflow and we could use all the data we need.
That's why I think it's important to make sure, at this point in time, that we open up more (preferably live) data and have them formatted and delivered in a way that the tech industry wants them.
P.s. I do like infographics, I just needed a black sheep for this blog post!
P.p.s. This once was a concrete idea but while writing it became a big blur of stuff I wanted to say, congratulations if you read through all of it!