fin: A Trading212 aggregator tool (for Yahoo)
🔗 Permalink

Table of contents
As you could see in my ROI stock series, I’ve been using Trading212 for a while now.
While it has some nice dashboards, I wanted more and since they offer a very nice CSV exporting feature, I decided to create my own Go-based tool to do aggregation and create a financial overview of my stocks.
💸 You can still use my affiliate link to get your own Trading212 account including a free stock of up to €100: https://www.trading212.com/invite/HrAs2dFZ
fin
fin is a Trading212 CSV utility that aggregates your transactional CSV files into a couple of output formats.
You can generate an aggregate formatted JSON file that’s used by the reporting tool,
or you can generate a yahoo formatted CSV file that can be imported into Yahoo Finance.
The tool deals with pies, stock splits and Yahoo ticker symbols. However, it’s required by the user
to maintain these settings in the config.yaml file. After running the tool for the first time
a default config.yaml file will be generated for you.
⚡ The goal of this tool is to give a big overview of your portfolio, along with fees and costs. It combines all transactions and comes up with a final tally, as such it’s not meant to help with taxes.
More info and download options: https://github.com/gerbenjacobs/fin
Config
There’s quite a few things you can configure, depending on how you want to split your aggregating or reporting.
We support pies (a subset of stocks within your portfolio), splits, renames and more. These however need to be configured by the user.
---
# Required config
input: data # folder where your Trading212 CSVs are stored
output: aggregated_quotes # name of output file (prefix)
format: aggregate # aggregate or yahoo

# Optional config
skip-pies: true # skip splitting by pies (default: false)
pie-only: "" # only generate this pie (default: "")

# Splits is a list of split events relevant to your portfolio
# this is needed to calculate the total stock count
splits:
  - symbol: ABEC
    date: 2022-07-16
    ratio: 20 # for reverse splits, use a decimal ratio

# Symbols is a list of conversions to take Trading212 symbols
# and convert them to the symbols used by Yahoo portfolios
symbols:
  RIO: RIO.L
  SAN: SAN.PA

# Renames deal with stocks that have changed their symbol
# for example by becoming a new company or by being delisted
renames:
  GPS: GAP
  TUP: TUPBQ

# Pies allows you split your aggregation into multiple CSVs
# uncomment to use
#pies:
#  - name: Growth
#    symbols:
#      - GOOG
#      - AMZN
#  - name: Dividend
#    symbols:
#      - PEP
#      - JNJ
Reporting
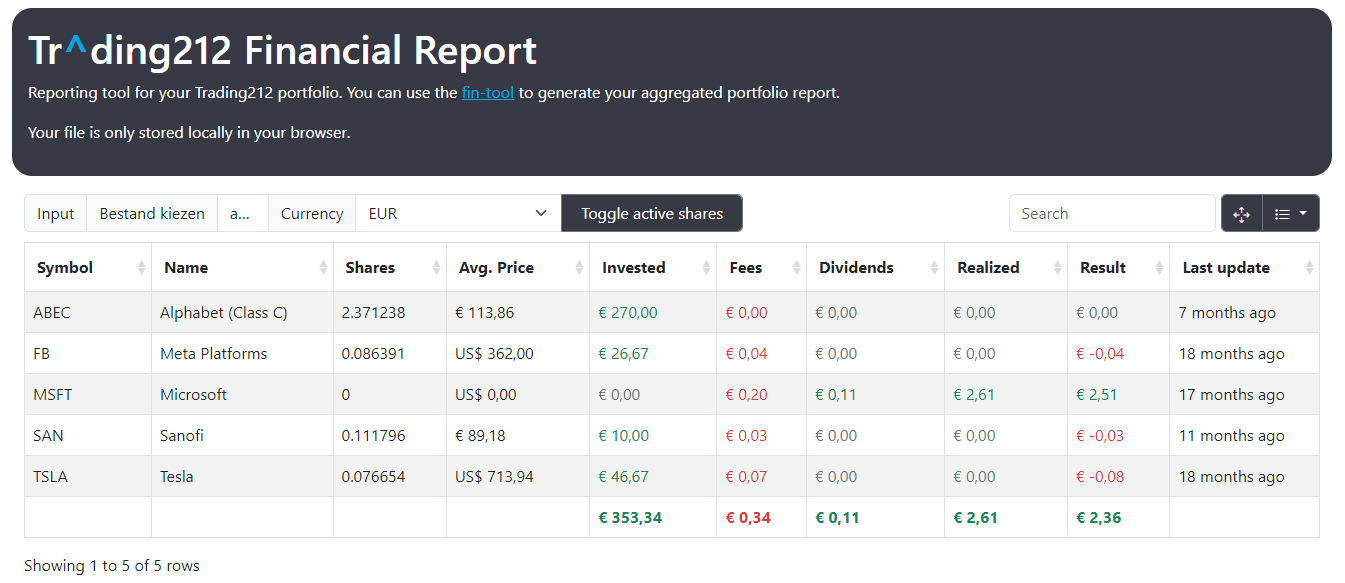
The project has a reporting tool that can be used to generate a report of your portfolio. It’s also available at https://fin.gerben.dev as hosted by GitHub Pages.
It uses jQuery, Bootstrap and Bootstrap Table to generate the report. It uses a local file mode with LocalStorage, and the resources coming from a CDN. None of the data is stored outside your browser.
agg.json
The data from all your buy, sell or dividend events are aggregated and if you use the aggregate
output method, it will look like this:
[
 {
  "Symbol": "ABEC",
  "Name": "Alphabet (Class C)",
  "ShareCount": 2.371231,
  "AvgPrice": 113.86,
  "PriceCurrency": "EUR",
  "ShareCost": 270,
  "ShareCostLocal": 270,
  "ShareResult": 0,
  "TotalDividend": 0,
  "Fees": 0,
  "Final": 0,
  "LastUpdate": "2022-07-29T14:28:17Z"
 },
 {
  "Symbol": "FB",
  "Name": "Meta Platforms",
  "ShareCount": 0.086391,
  "AvgPrice": 362,
  "PriceCurrency": "USD",
  "ShareCost": 31.27,
  "ShareCostLocal": 26.67,
  "ShareResult": 0,
  "TotalDividend": 0,
  "Fees": 0.04,
  "Final": -0.04,
  "LastUpdate": "2021-08-09T18:31:41Z"
 },
 {
  "Symbol": "MSFT",
  "Name": "Microsoft",
  "ShareCount": 0,
  "AvgPrice": 0,
  "PriceCurrency": "USD",
  "ShareCost": 0,
  "ShareCostLocal": 0,
  "ShareResult": 2.61,
  "TotalDividend": 0.11,
  "Fees": 0.2,
  "Final": 2.51,
  "LastUpdate": "2021-09-30T11:15:32Z"
 },
 {
  "Symbol": "SAN",
  "Name": "Sanofi",
  "ShareCount": 0.111796,
  "AvgPrice": 89.18,
  "PriceCurrency": "EUR",
  "ShareCost": 9.97,
  "ShareCostLocal": 10,
  "ShareResult": 0,
  "TotalDividend": 0,
  "Fees": 0.03,
  "Final": -0.03,
  "LastUpdate": "2022-03-07T16:10:26Z"
 },
 {
  "Symbol": "TSLA",
  "Name": "Tesla",
  "ShareCount": 0.076654,
  "AvgPrice": 713.94,
  "PriceCurrency": "USD",
  "ShareCost": 54.72,
  "ShareCostLocal": 46.67,
  "ShareResult": 0,
  "TotalDividend": 0,
  "Fees": 0.07,
  "Final": -0.08,
  "LastUpdate": "2021-08-09T18:31:41Z"
 }
]
yahoo.csv
Using the yahoo output format and writing to yahoo.csv we get this:
Symbol,Current Price,Date,Time,Change,Open,High,Low,Volume,Trade Date,Purchase Price,Quantity,Commission,High Limit,Low Limit,Comment
FB,0,0001/01/01,00:00 UTC,0,0,0,0,0,20210809,362,0.086391,,0,0,
GOOG,0,0001/01/01,00:00 UTC,0,0,0,0,0,20220729,117.75,2.292856,,0,0,
SAN.PA,0,0001/01/01,00:00 UTC,0,0,0,0,0,20220307,89.18,0.111796,,0,0,
TSLA,0,0001/01/01,00:00 UTC,0,0,0,0,0,20210809,713.94,0.076654,,0,0,
Running
You can download the binaries or compile the Go code, or even run from within a cloned project.
go run cmd/aggregator/main.go --config config.yaml
INFO[0000] Starting process.                             format=aggregate input=testdata output=agg pie-only= pies=0 renames=2 skip-pies=true splits=1 symbols=2
INFO[0000] Completed aggregation.                        cash=1650.58 deposits=2000 dividends=0.11 fees=0.34 interest=0 invested=353.2 realized=2.61 realized-with-costs=2.25 taxes=0.02 withdrawals=-1.4
INFO[0000] Written 6 entries to agg.json.
It’s free of charge, covers most cases, but is not 100% perfect. There’s always issues with float arithmetics.
The tool tries its best to deal with multiple currencies, but because of the fluid nature of foreign exchange rates it’s all based on best estimate.